I’m drawn to disentangling intricate geologic and geospatial relationships through the integration of numerous datasets and techniques. This has led me to use outcrop and subsurface geology, laboratory techniques, and modern data science workflows to analyze the rock record and provide insights into pointed industry-related problems.
This portfolio consists of a range of projects that describes that demonstrate my abilities in the following fields:
- Sedimentary geology
- Geospatial analysis, remote sensing, and cartography
- R, RMarkdown, RShiny
- Data science (cleaning through modeling)
Data Analysis/Science Portfolio (tools and visualizations)
stRat stat || GitHub Repo || shinyapps.io version || CSPG 2020 Talk
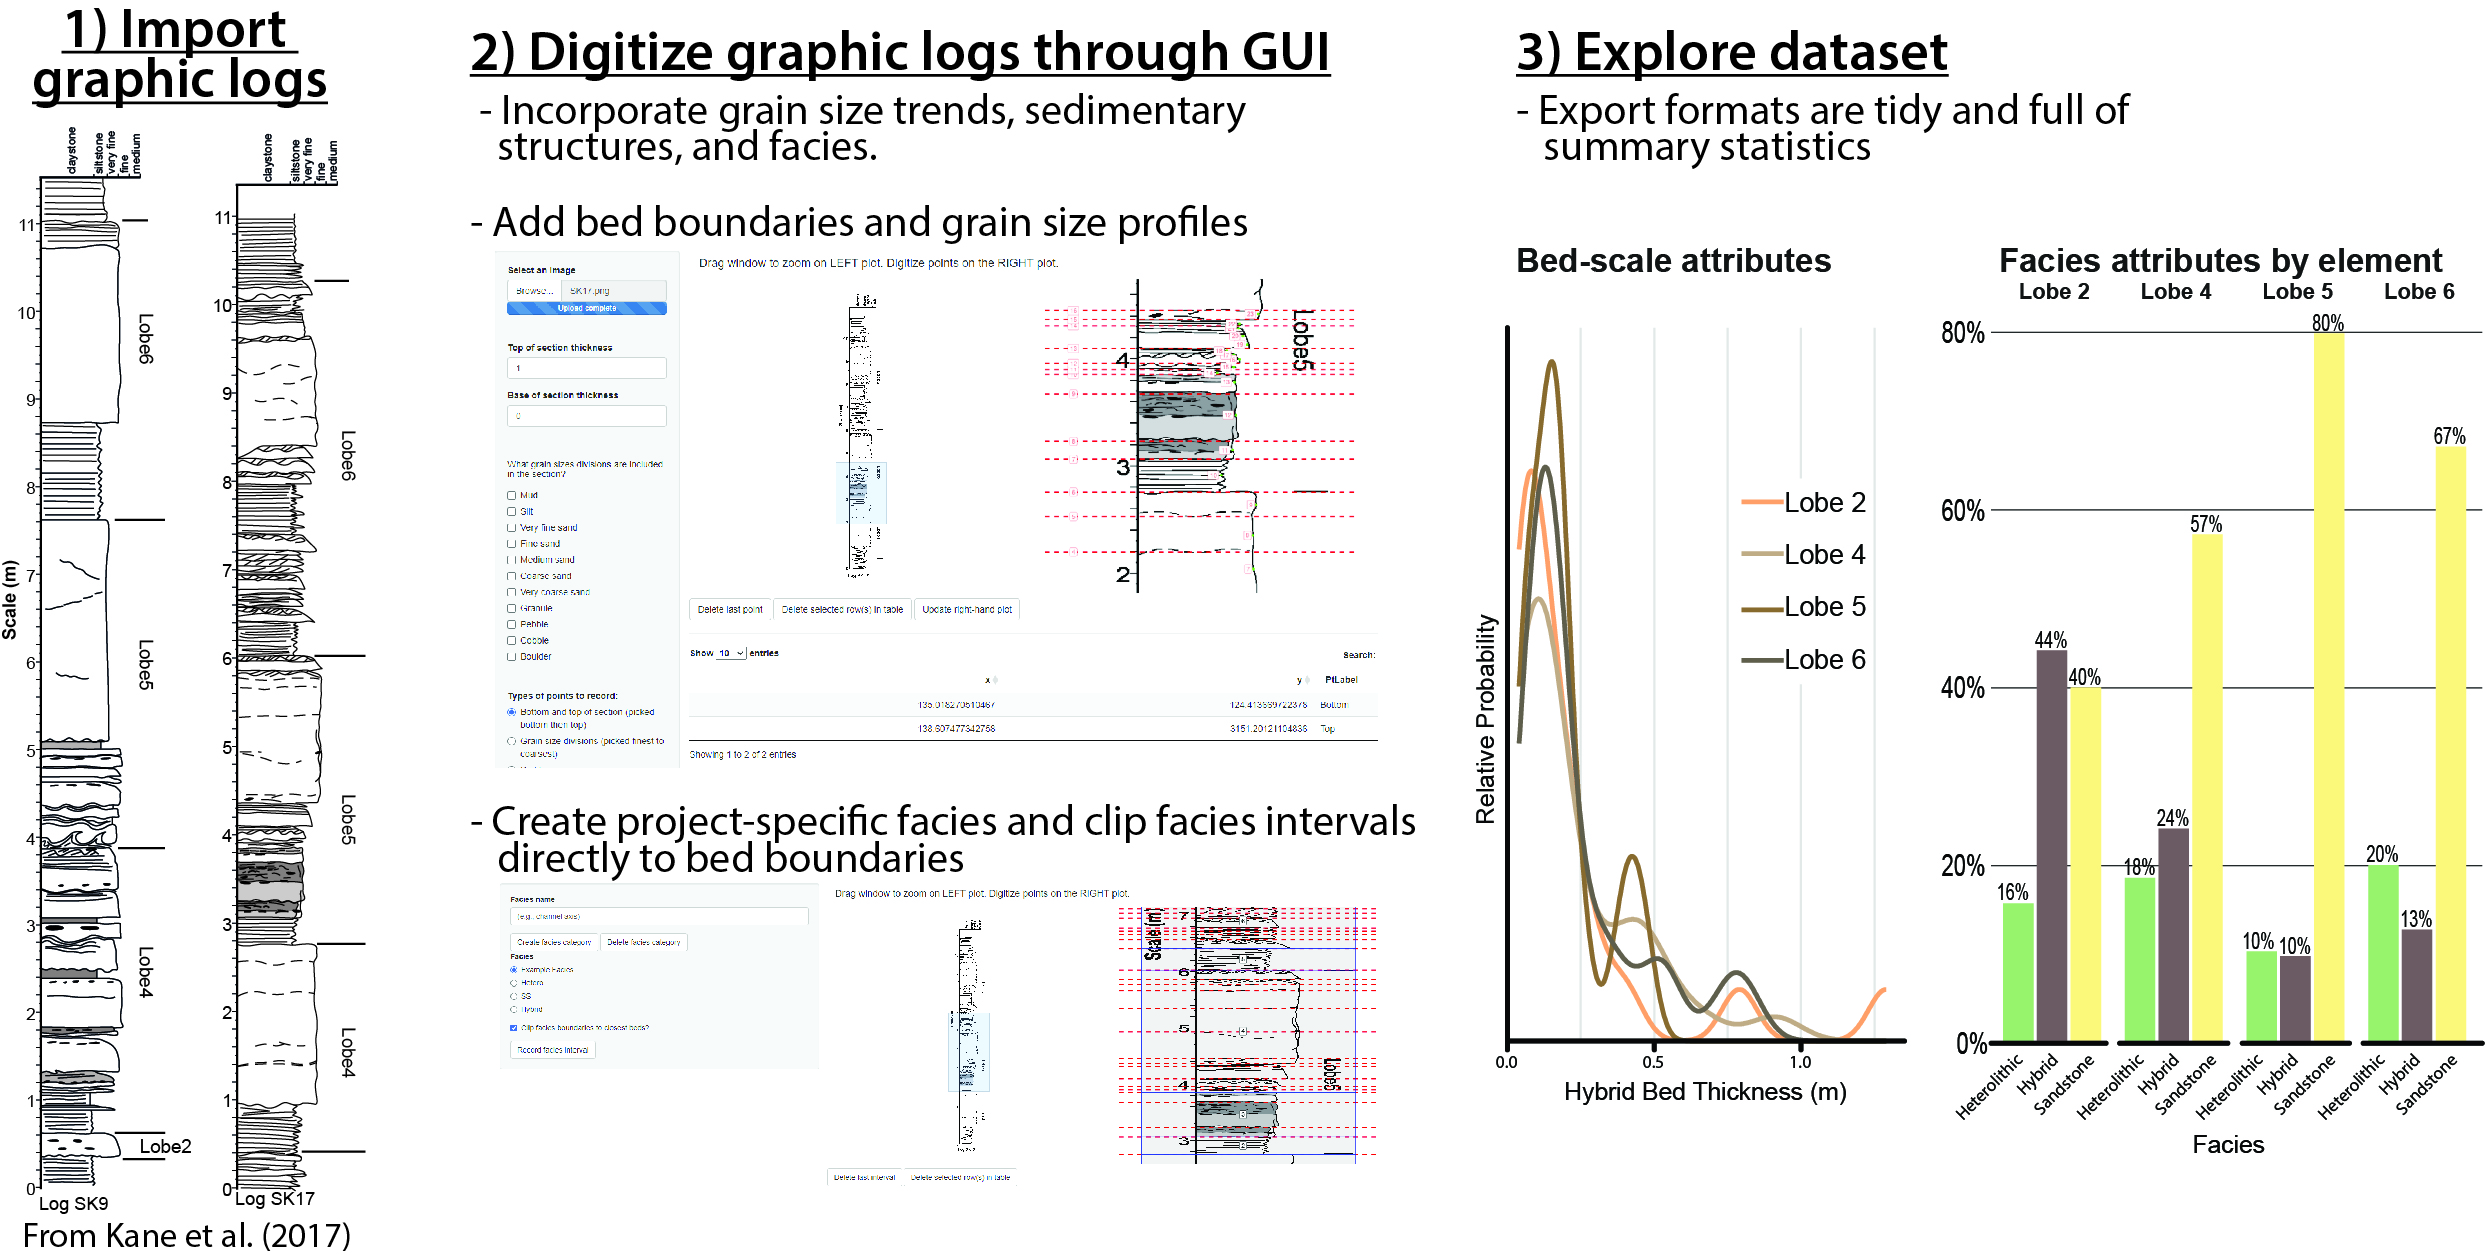
Graphic logs (i.e., core logs or measured sections) are one of the most commonly used tools to illustrate the heterogeneity of sedimentary deposits. Although they are very common, they are rarely leveraged for quantitative analysis. In this project I developed an open-source GUI-based app that allows users to digitize then automatically summarize graphic log data for use in exploratory data analysis or modeling. Check out the GitHub Repo or this blog post.
Mapping under-exploited reservoir targets through production curves
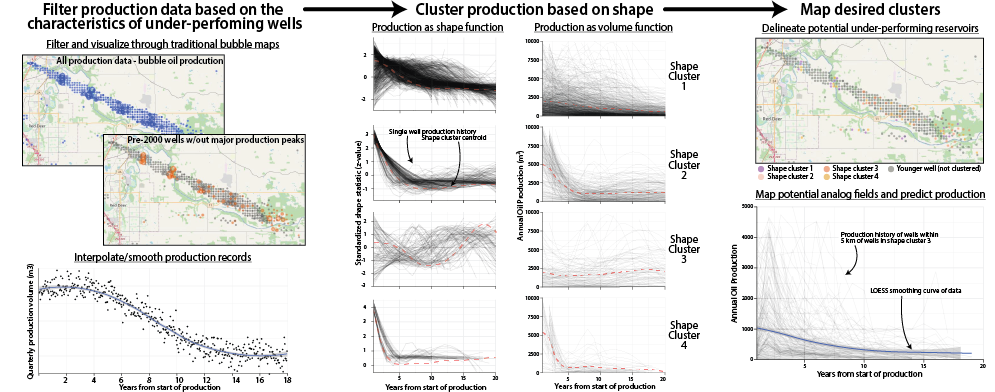
Production data is often used to map high-performing and low-performing reservoirs, however the gross production of a well or field does not tell the whole store about potential performance. This project set out to find potential reservoir targets that are currently under-performing by mapping common production curve shapes. This involved cleaning annual production data for the entire WCSB, fitting GAM models to de-noise production data, clustering production curves into common shapes using dynamic time warping, and performing spatial analysis on the resulting clusters to find potential targets and analogs.
ASTER sensor workflow || GitHub Repo
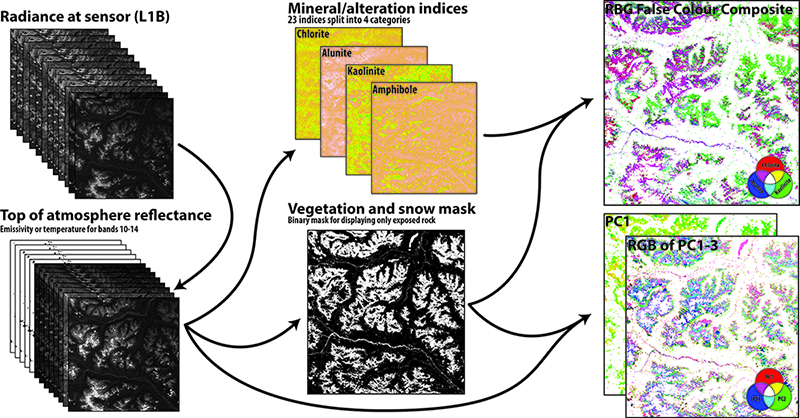
The ASTER sensor on the TERRA satellite is one of the premiere multispectral sensor for mapping geologic bodies. This project focused on creating an object-oriented stack of functions that processed ASTER data from freely-available L1B data to top of atmosphere reflectance. Additional functions mask vegetation and snow, create mineral indices, and produce principle component analysis RGB false-colour composites.
Various RShiny dashboards and tools
These two projects were single day challenges I gave myself to test my ability to go from a schematic (list of functions+variables and a sketch of a UI) to a working prototype. Admittedly, I have spent more than just those single days on each app polishing them at this point.
Geologic data visualizer || shinyapps.io version
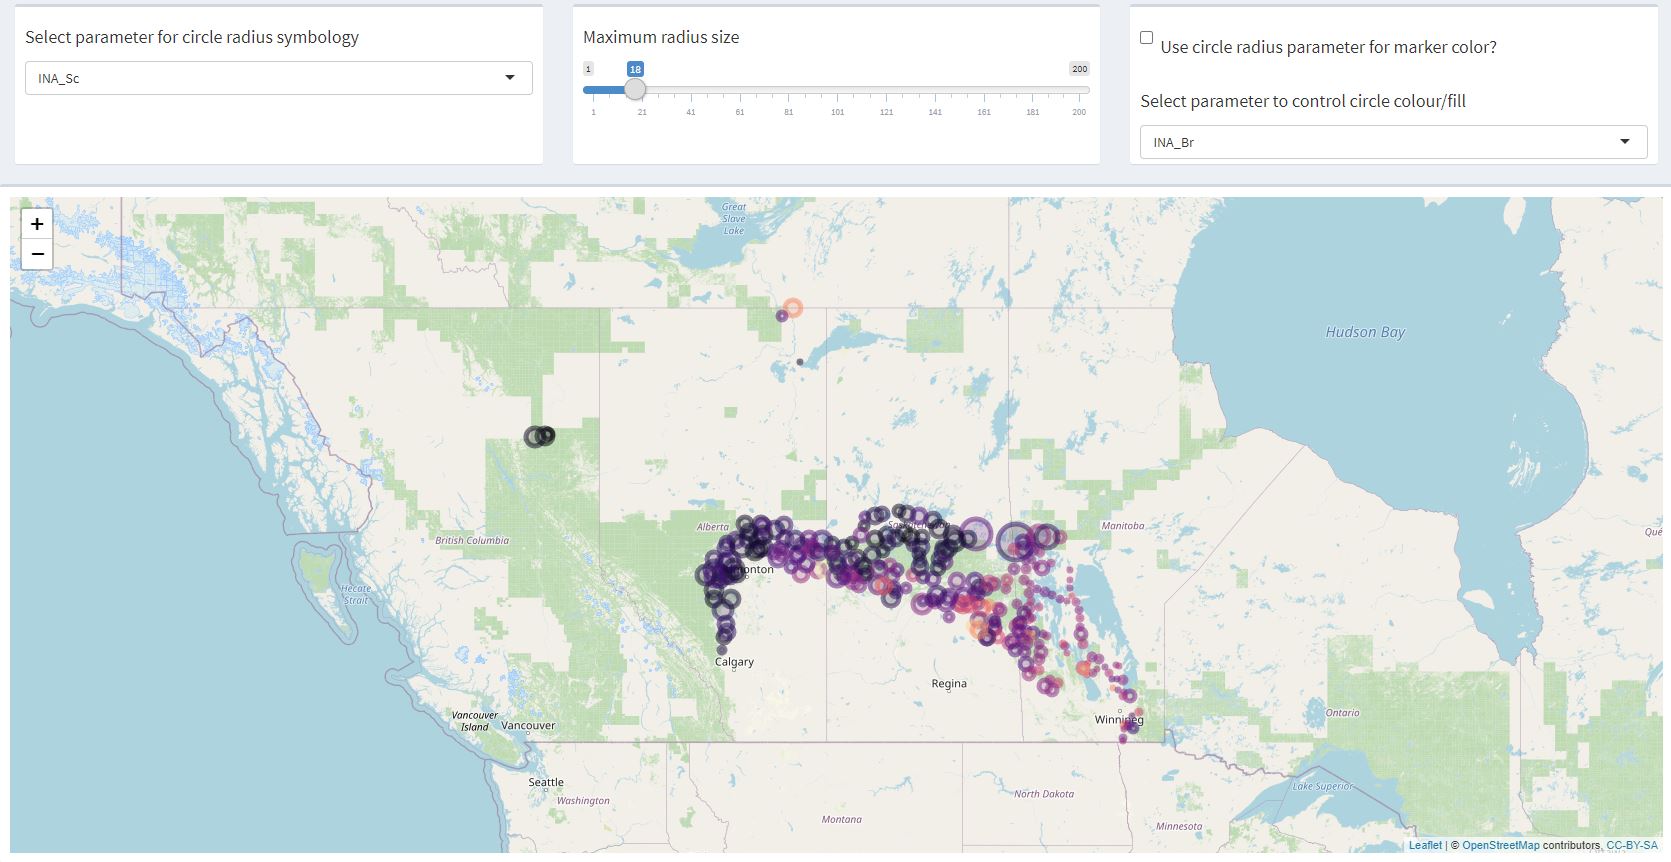
Geologic data can have spatial, temporal, numeric, and categorical properties. Lastly, it is almost always very messy. This project saw the design of a simple dashboard that can be used to visualize geologic data from multiple datasets that have a spatial component. The dashboard includes dataset selection, spatial visualization with dynamic user-controlled symbology (seen below), and dynamic x-y plotting.
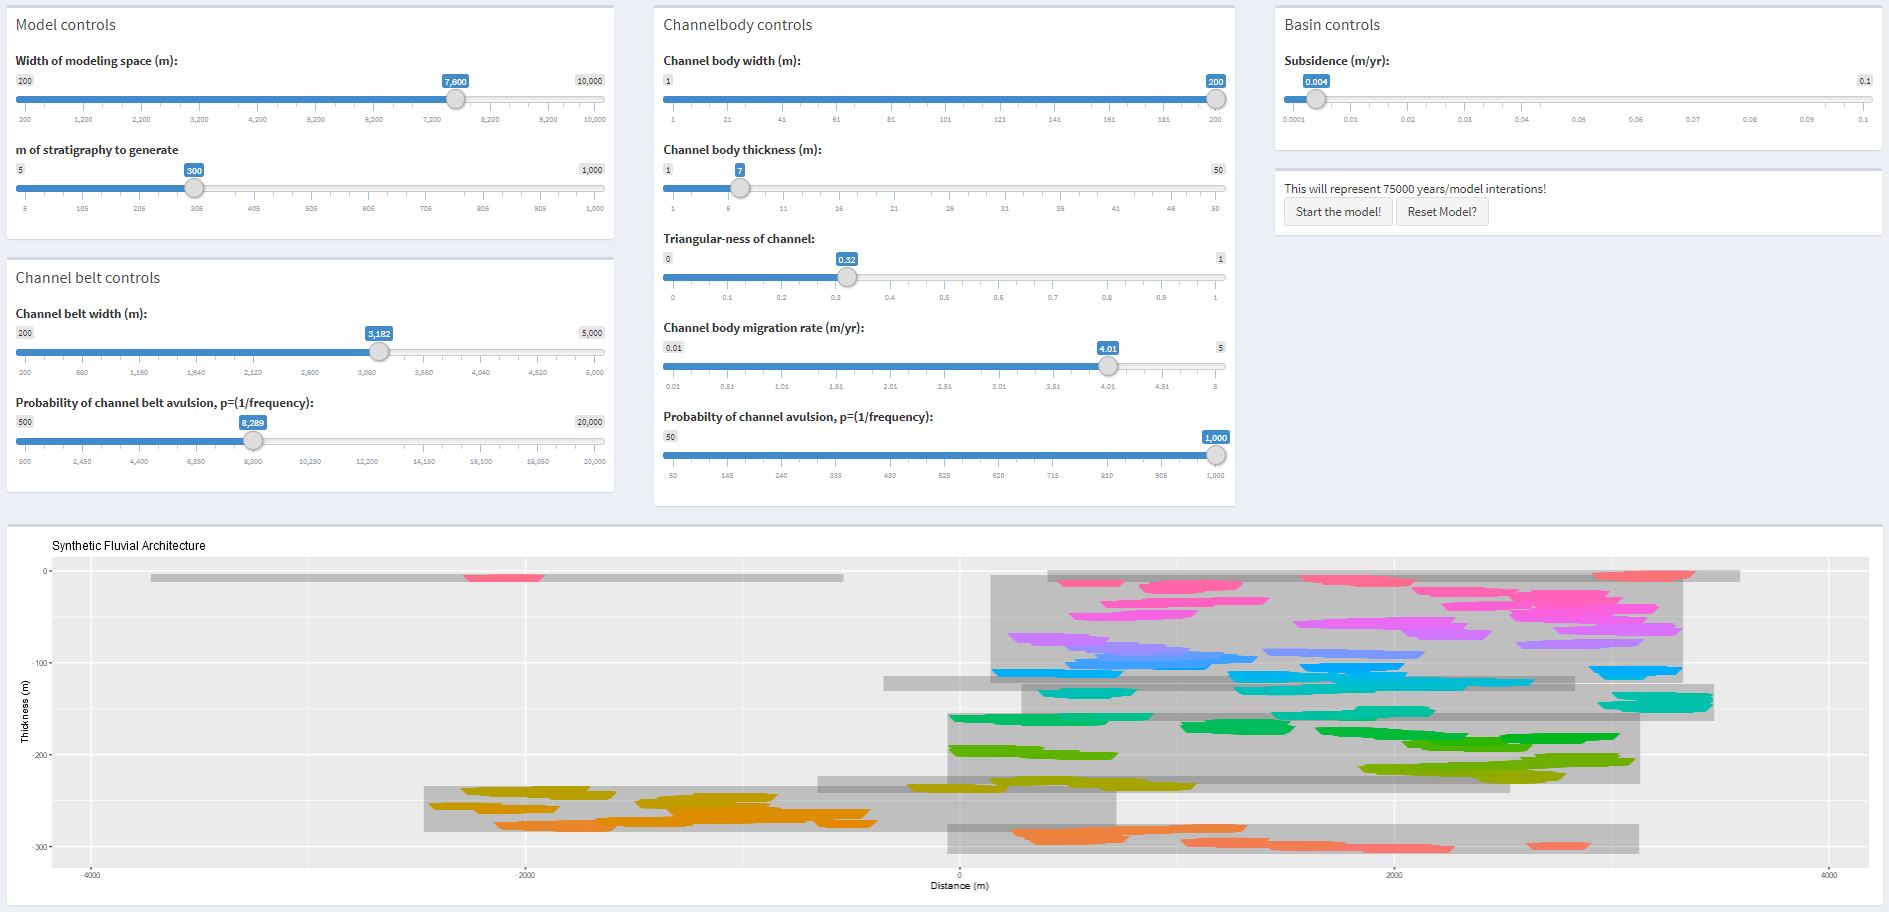
Simple stratigraphic forward model of fluvial deposits || GitHub Repo || shinyapps.io version
The ability to visualize sedimentary processes and how various parameters coalesce to build stratigraphy is a skill that takes a long time to develop but is fundamental to understanding, mapping, and predicting the nature of sedimentary sequences. An easy way to help individuals understand this is through the use of numerical models that stochastically produce a model of stratigraphy given a set of inputs. In this project I designed a simple stratigraphic forward model of fluvial deposits that runs in a RShiny GUI.
Industry Expereience
Visual Mud Index Development || CNOOC International || Jan-Dec 2017
At CNOOC I was tasked with developing a methodology to extract estimates of mud content from core photos of oil sands reservoirs. I achieved this using photo-thresholding techniques. Once thresholded, the thickness and number of beds could be extracted for each reservoir facies. These data were then used to form new distributions for geomodel variables (e.g., Vsh, net:gross) and to deduce the impact of mudstone baffles in steam chambers. I expanded the project to explore how these techniques could be used to analyze and classify the different types of mudstone breccia found within oilsands reservoirs.
Academic/Research Work
My academic research has largely focused on constraining the evolution of sedimentary systems in response to tectonic/basin processes. I’ve done this by incorporating field methods and subsurface mapping with U-Pb detrital zircon data, and numerical models to better understand how these systems evolve and how we can best constrain their evolution.
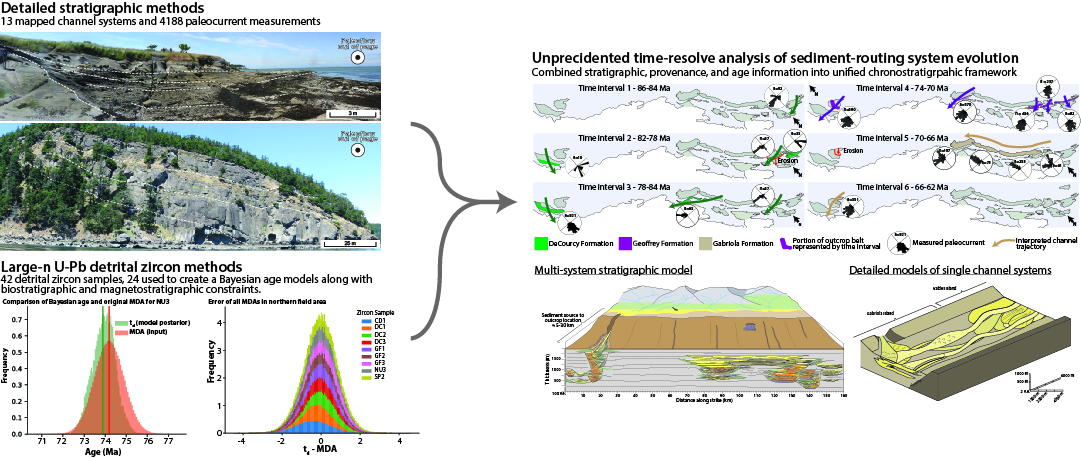
My PhD work focused on deducing the allogenic controls on deep-water channel systems preserved in the upper Nanaimo Group, British Columbia, Canada. This was done by integrating field stratigraphy (field mapping, stratigraphic sections) with U-Pb detrital zircon techniques to constrain the timing of deep-water channel system sedimentation and compare it to the tectonic evolution of the near-by Coast Mountains. Previously worked on translating the stratigraphic architecture of fluvial systems of the Belly River from outcrop to the subsurface. I have also assisted with numerous graduate and undergraduate projects in the fields of basin analysis, sedimentology, and reservoir characterization.
Publications are listed listed chronologically from most recent.
-
Coutts, Hubbard, Englert, Matthews, IN REVIEW, Twenty million years of deep-water sedimentation in response to forearc basin dynamics, The Depositional Record.
-
Englert, Hubbard, Cartigny, Clare, Coutts, Hage, Hughes Clarke, Jobe, Lintern, Stacey, Vendettuoli, 2020, Quantifying the three‐dimensional stratigraphic expression of cyclic steps by integrating seafloor and deep‐water outcrop observations, Sedimentology, DOI: https://doi.org/10.1111/sed.12772.
-
Coutts, Matthews, Englert, Brooks, Boivin, Hubbard, 2020, Along-strike variations in sediment provenance within the Nanaimo basin reveal mechanisms of forearc basin sediment influx events, Lithosphere, DOI: https://doi.org/10.1130/L1138.1.
-
Englert, Hubbard, Matthews, Coutts, Covault, 2019, The evolution of submarine slope-channel systems: Timing of incision, bypass, and aggradation in Late Cretaceous Nanaimo Group channel-system strata, British Columbia, Canada: Geosphere, DOI: https://doi.org/10.1130/GES02091.1.
-
Coutts, Matthews, Hubbard, 2019, Assessment of widely used methods to derive depositional ages from detrital zircon populations: Geoscience Frontiers, DOI: https://doi.org/10.1016/j.gsf.2018.11.002.
-
Englert, Hubbard, Coutts, Matthews, 2018; Tectonically controlled initiation of contemporaneous deep‐water channel systems along a Late Cretaceous continental margin, western British Columbia, Canada: Sedimentology, DOI: https://doi.org/10.1111/sed.12472.
-
Matthews, Guest, Coutts, Bain, Hubbard, 2017, Detrital zircons from the Nanaimo basin, Vancouver Island, British Columbia: An independent test of Late Cretaceous to Cenozoic northward translation: Tectonics, DOI: https://doi.org/10.1002/2017TC004531.
I am also an active peer reviewer for journals in these fields: Frontiers in Geoscience, Earth Science Reviews, Earth Science Frontiers, Geological Magazine, and Basin Research.