TOC
Designing a piece of software is challenging - defining minimum requirements, potential user desires, and platform limits is all very tricky. stRat stat was my first attempt at creating a cohesive application. This post focuses how got around the major hurdles of the the diversity of data taht would be input into the app. If you want to know more about the features and uses of stRat stat, check out GitHub repo or my 2020 CSPG talk on stRat stat.
The Problem - Data diveristy in graphic logs
Graphic logs (i.e., core logs or measured sections) are one of the most commonly used tools to illustrate geologic heterogeneity of sedimentary deposits. These data types are entirely graphical, often drawn by hand in the field, then digitized in a drafting software (e.g., Adobe Illustrator, Corel Draw). They are composed of an x-axis that represents the grain size of the unit, and the y-axis is the thickness. The log consists of drawn intervals that represent individual beds or groups of beds depending on the scale. Although they are very common, they are rarely leveraged for quantitative analysis and are justed used for visual analysis and description.
A distinct problem of turning these data into a truly digital version is the richness (amount of data) and diversity of data. Geologists follow few data schemes beyond names of sedimentary structures and rock types. Some geologists use generic symbols to represent sedimentary structures and rock types, others draw what they see. Additionally, logs can be drawn where grain size (x-axis) increases to the right, or coarsening to the left. The application needed to be able to include any number of sedimentary structures, and infinite categories and names of different rocks units. Lastly, because geologists are not a very techy bunch (on average) I wanted the application to be within a single UI, web-ready, and export a simple .csv that could be analyzed in any software.
stRat stat design challenges
1) RShiny GUI for Digitization
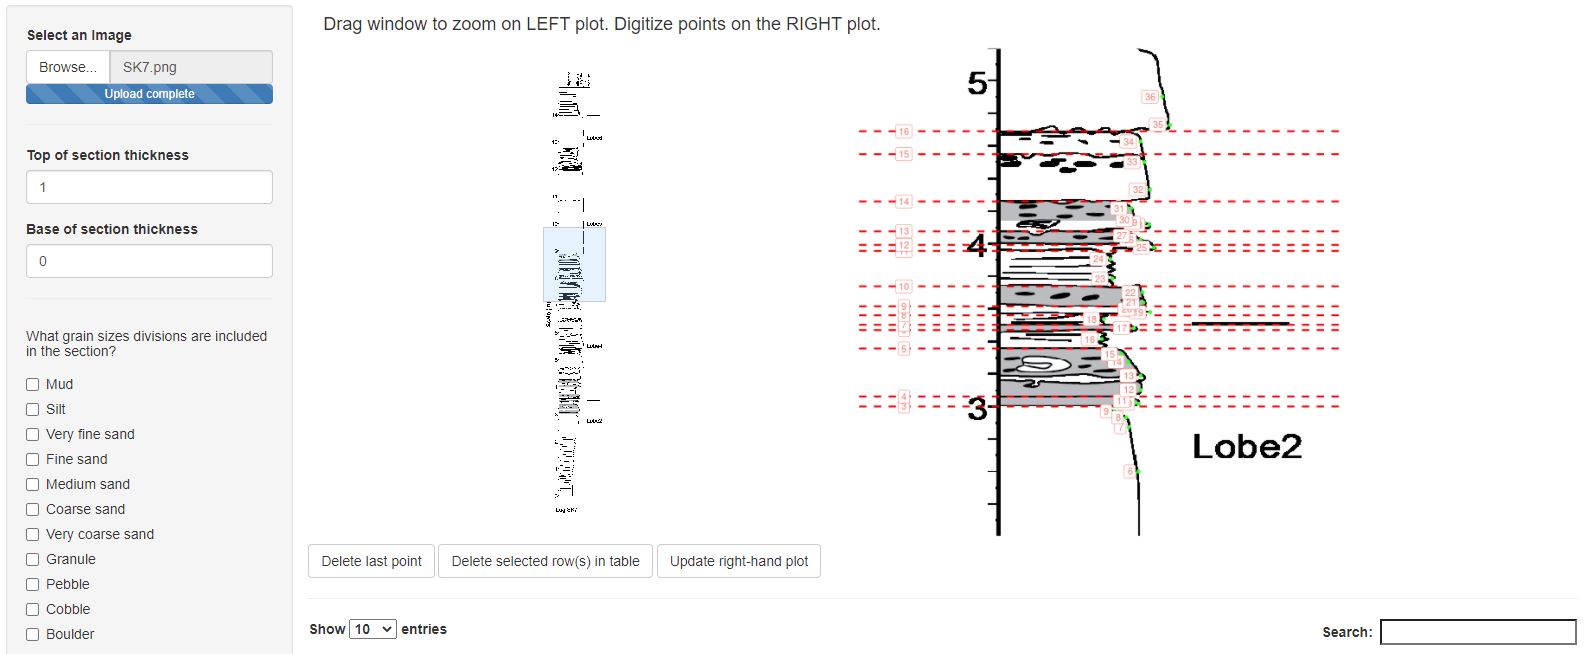
Firstly, geologists are a famously analog group of scientists. To make a piece of software that would be usable by all geologists. It had to be have a simple GUI, full stop. Secondly, the most accurate way to collect data from a diverse range of stratigraphic section formats (x-axis increasing to the left or right, different colour schemes, or different symbologies) is manual digitization. Due to the non-standardized nature of the data, this is the only way forward. In an upcoming manuscript (keep your eyes peeled!) we do suggest some formats that may allow for future machine learning techniques to exploit. Point-and-click digitization allows for all edge cases to be caught in a very accurate way.
In Shiny, this was accomplished by interacting with plots. On the digitization pages, there are two plots, where brushing a box on the left plot scales the coordiates and filters the points see on the right plot. The actual digitization works in a similar way, where pixel coordinates are recorded based on plot interactions on the right plot. These coordinates are written to a reactive dataframe and are later converted from pixel location to grain size and/or thickness measurements.
2) User-generated rock classifications
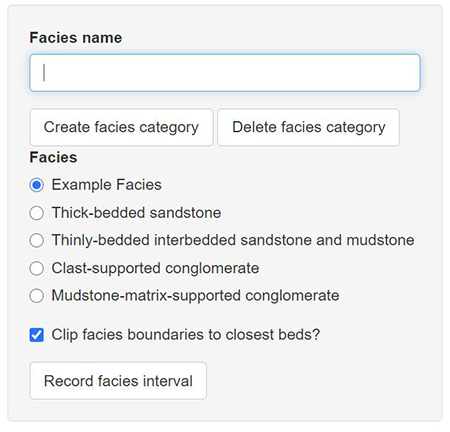
Geologist have different naming conventions for groups of rocks. It would be impossible to include all the different sedimentary structures (features in the rocks), or the possible names given to specific intervals. To surmount this hurdle, user-generated categories were implemented so that users can apply their naming conventions to graphic logs and avoid a huge list of of rock types or features where <1% is applicable to the project. This UI has two steps:
- A text input takes the user-defined name (e.g., thick-bedded sandstone) to an array that contains all the names that have been generated by that user.
- A set of radio-buttons is rendered that includes all the names in the first array. Users interact with these radio buttons to select which type of rock or rock feature they want logged in the interval they selected on the log. Because geologists have specific names and requirements, this process is almost expected by the user, however by implementing this user interface in multiple places (for sedimentary structures, facies, elements, element-sets) this workflow becomes very familiar to the user.
Lastly, the categories created by the user (seen below) can be easily stored save file (when work is saved for later) so that these options are loaded back in. If desired, specific choices could be hard-coded in to a local version to keep naming conventions similar across multiple sections.
3) Joining discrete and continuous data:
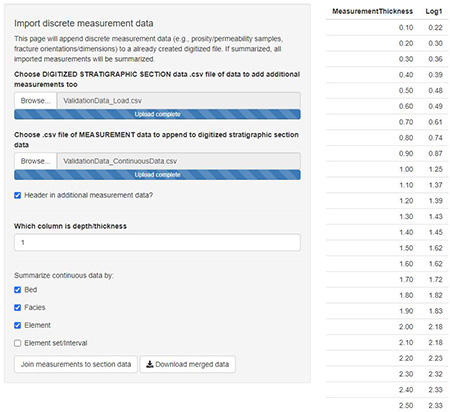
Geologist love sampling rocks and testing them in innumerable ways (isotopes, organics, mineralogy, density, etc.). This is how geologist make inferences about how the Earth has changed over time. These samples need to be related to the rock interval that they come from and are either discrete measurements (a rock sample taken for isotope measurement) or can be rather continuous (petrophysical measurements collected along a borehole). To join these data to the section I implemented two different panels, with similar functions to join the data depending if it is discrete or continuous.
As one of the stRat stat outputs is a discretized version of the stratigraphic section, these data need to be joined to the similar scale.
For discrete measurements, the thickness/depth of each sample are rounded to the nearest increment of the stRat stat section and are joined.
Continuous measurements can be collected at various sampling rates depending on the device, mm between measurements or cm between measurements. In the case of finer-scaled data, rolling mean (depending on the scale) is applied to the data, then the data is joined. For coarser-scale data, the data is interpolated, then joined to the stRat stat data.
Additional learnings from a newbie (0 to 60 in software design and R)
This project is how I started learning R. It might have been a bit ambitious, but worked out in the end. For people looking to start an large project like this I have two suggestions:
1) Work within your domain knowledge: Because this my first large project I found that working within my domain knowledge (sedimentary geology) allowed me to better understand the needs and requirements of the tool and users. It allowed me to build something that has instant application and gave the project more meaning.
2) Work in integrated UX/UI framework: I’ve always thought it would be cool to make a useful geology app. Using RShiny allowed me to do this while learning one programming language. It takes the R code and produces fantastic looking widgets, reactive and interactive plotting. As someone who is just getting into programming this kind of simplified design is fantastic. RShiny has a lot of interesting syntax in the form of reactive variables and elements. This was very hard for me to figure out in the beginning but the documentation and online examples are very excellent! If you’re interested in making a dashboard or tool like this but work in a different language, there are similar packages/libraries for python (like Streamlit).
What’s happening with stRat stat in 2021
A graphic log digitizer-focused publication
Zane and the original tool authors at Shell and Mathworks, along with Zane’s group at CSM, have been very welcoming to my implementation of the tool in R. Zane has been spearheading a project that takes the export .csv from stRat stat or the Matlab Digitizer produce visualizations that aid in understanding the heterogeneity at a bed or facies level. We’re currently working on a manuscript so keep your eye’s peeled for that!
Predicting sedimentary environments from digitized logs
I’ve been toying with the idea of ditigizing a wide variety of stratigraphic sections from various sedimentary environments, to see how well they can be identified by machine learning algorithms. The model could then be used in exploration scenarios where the core is logged by geologist - interprations are made, then double checked against a library of global analogs. If you’re interested in this, let me know.